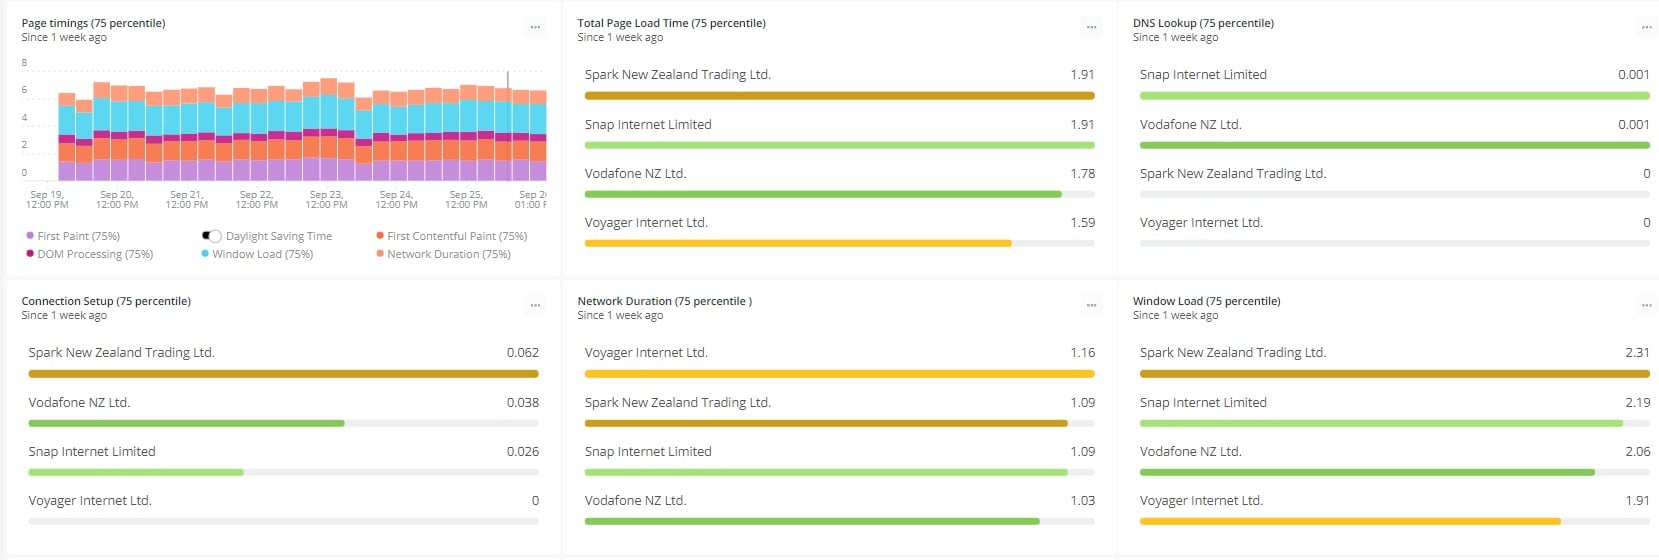
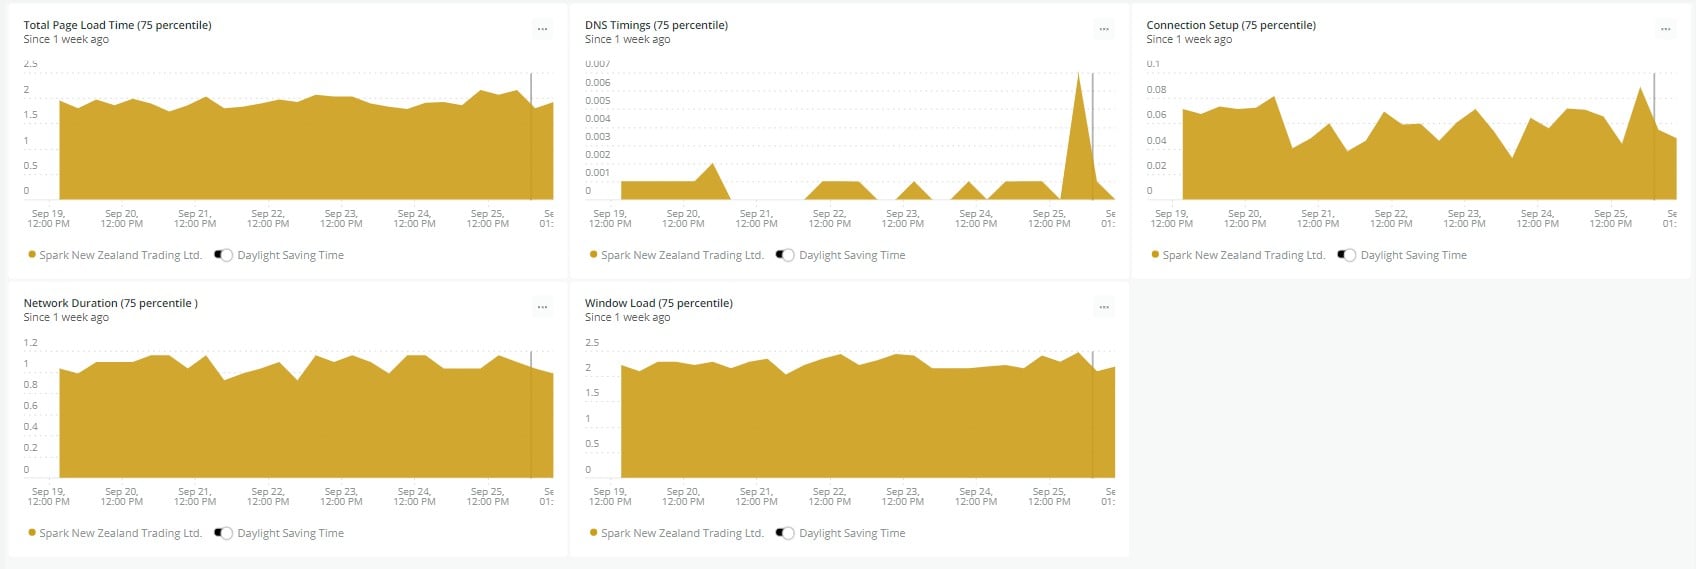
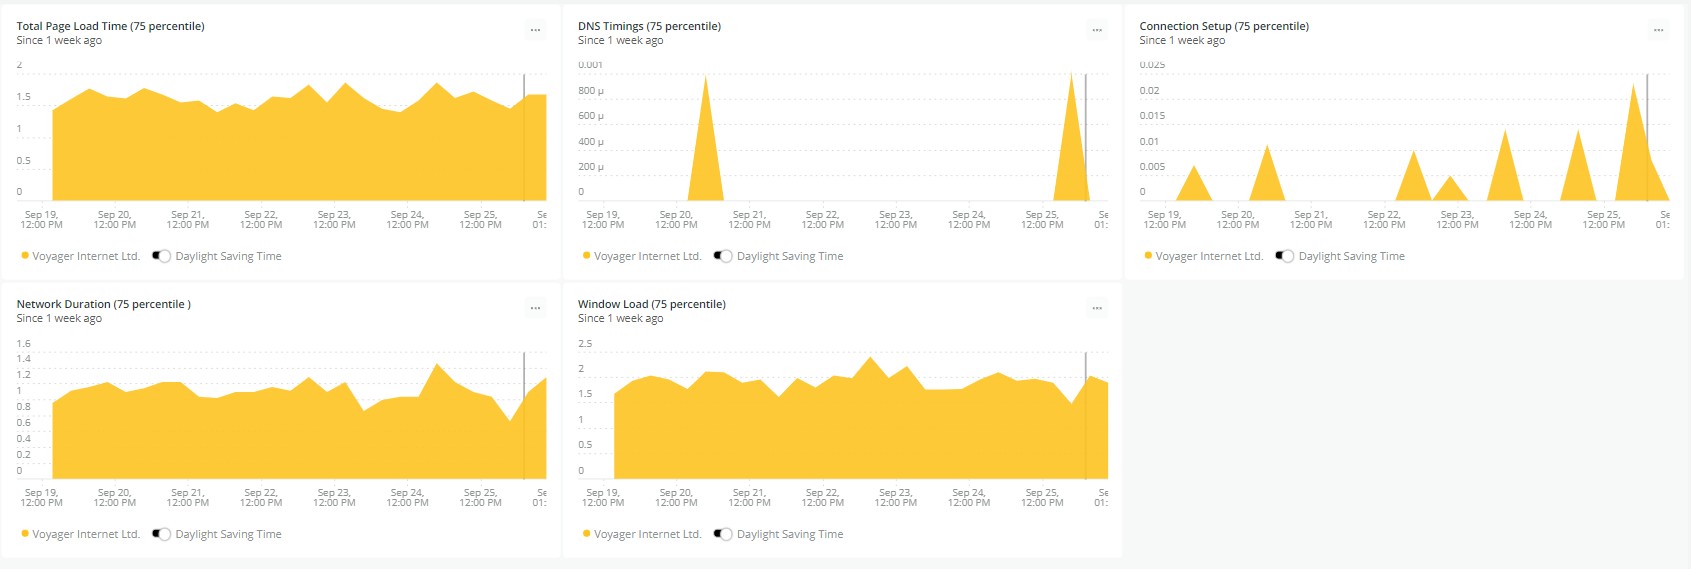
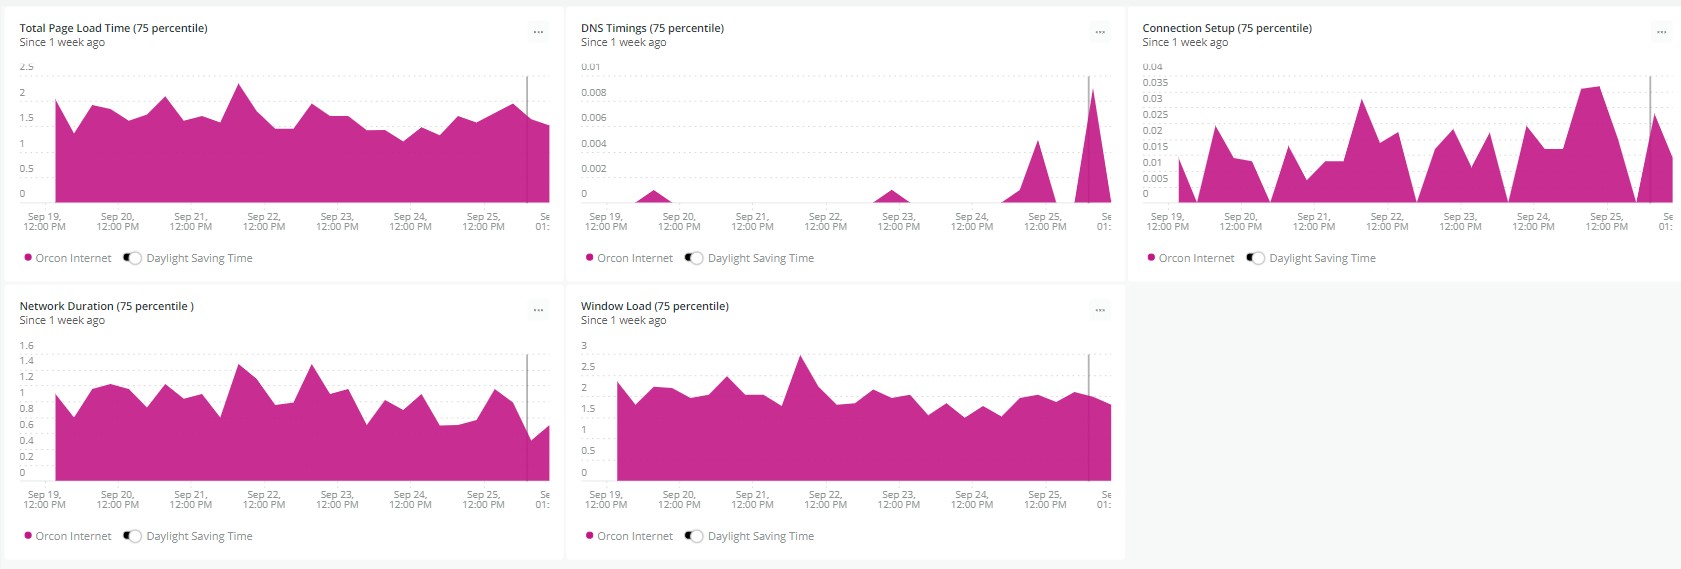
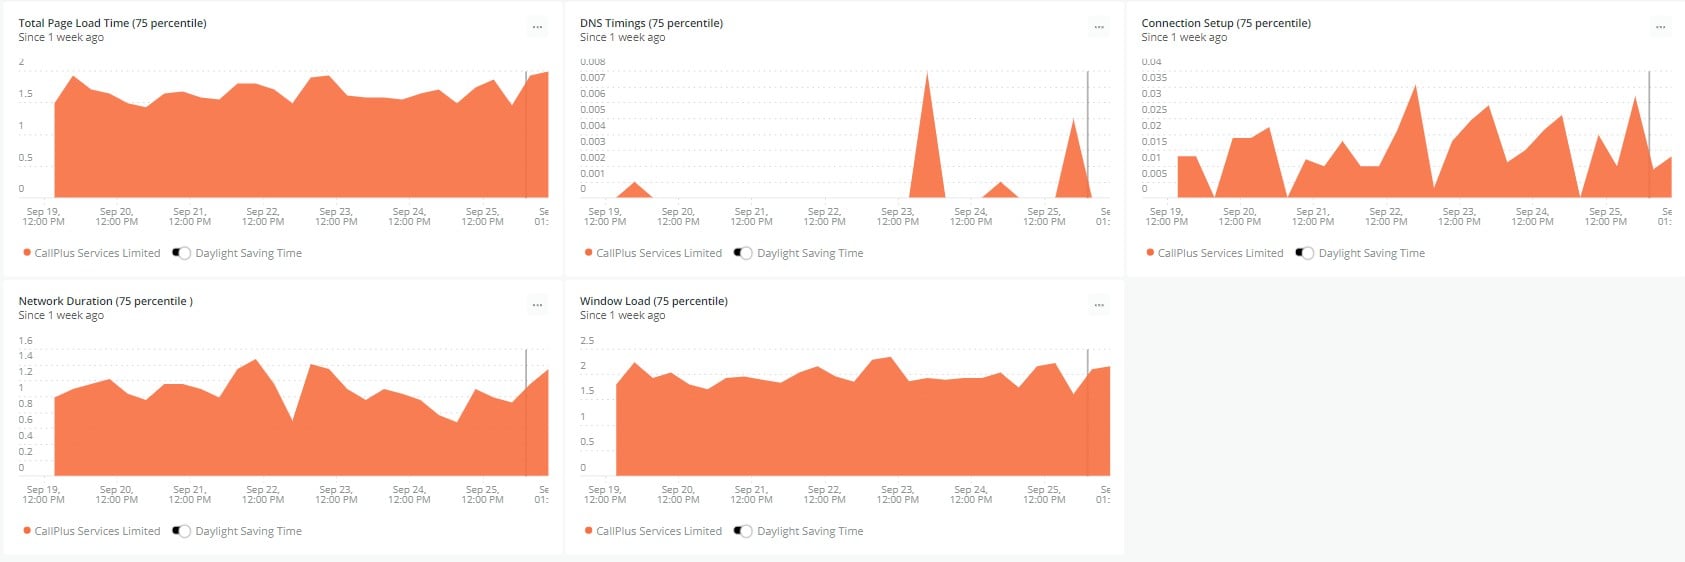
Some charts of performance, by ASN, when loading Geekzone.
- On these charts, lower values are better.
- All data is based on 75 percentile.
- DNS is not always done via default DNS as users can change their DNS but based on the volume of pageviews I assume this wouldn't impact the score for each network.
- The charts are based on browser monitoring APIs so Window Load will include all traffic needed to complete a page view - including external scripts, css, ads.
- Charts are manually updated.
- Tables are automatically updated and list last seven days.
[CHARTS LAST UPDATE 26 SEP 2021, TABLES UPDATE IN REAL-TIME]
Four ISPs comparison:
2degrees:
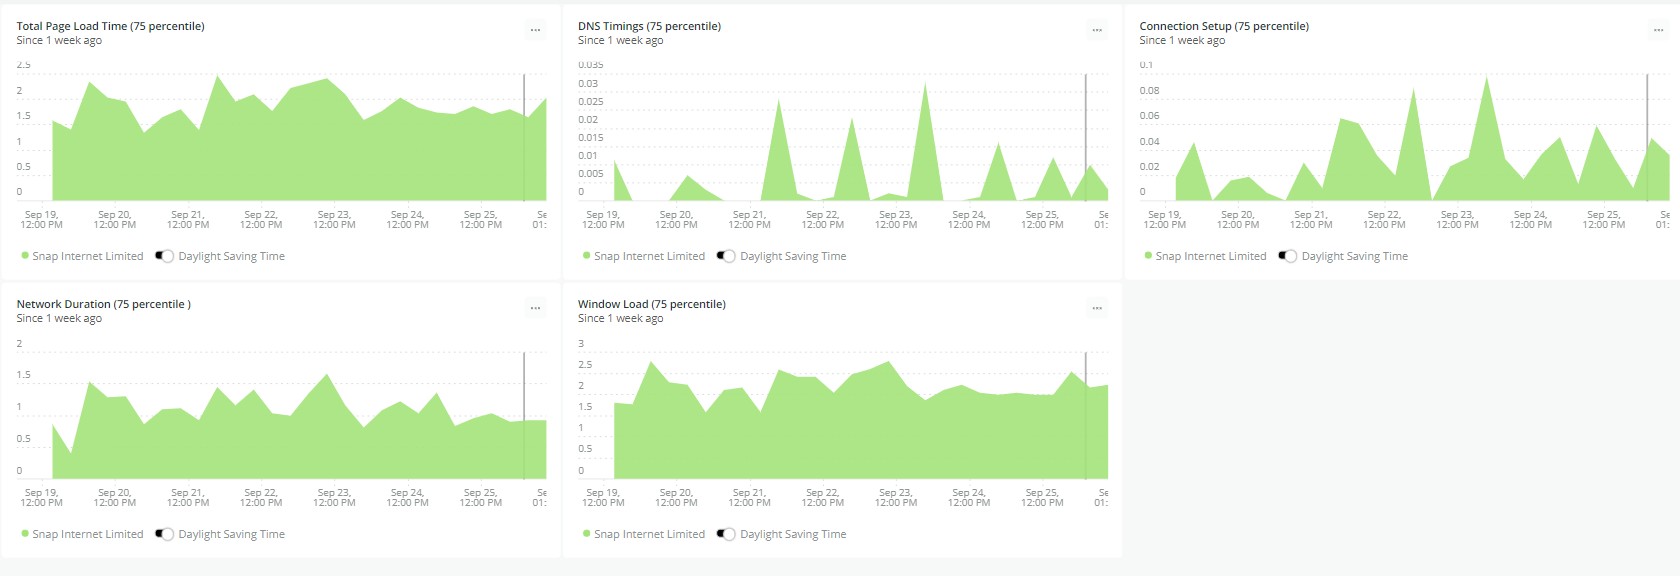
Spark:
Voyager:
Orcon:
Callplus:
Below are some tables you can interact with (change time period and sort order):