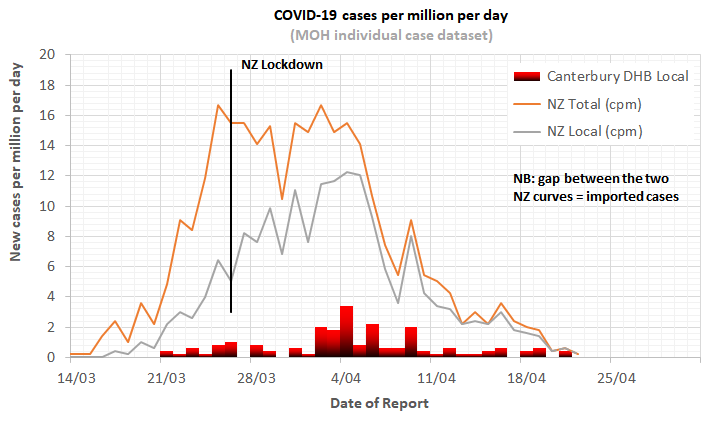
Thanks. Interested in Christchurch, so I guess that’s Canterbury DHB.
I’d also be interested in the historical data of the Christchurch clusters - so I can see over time how many cases were associated with known clusters vs not.
Plot comparing Canterbury DHB local cases to NZ cases - fyi. Will leave you to update in future 🙂.
Note that the Canterbury numbers of cases have been divided by the total NZ population (4.97m*) so can compare with the NZ numbers. If you want actual numbers, will leave it for you to do! Just multiple by 5 will get you near enough. (*now 4.98m, http://archive.stats.govt.nz/tools_and_services/population_clock.aspx)
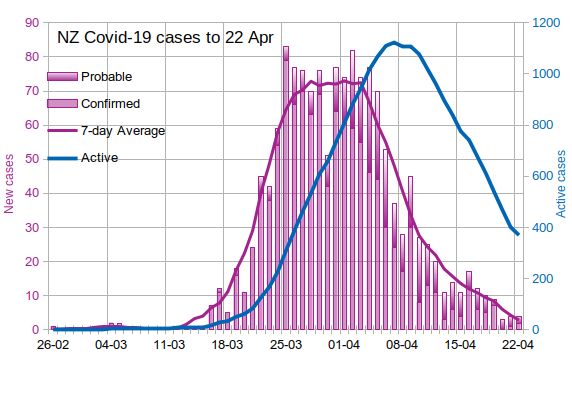
For NZ as a whole, the 401 remaining active cases are equivalent to the last 18 & a bit days worth of cases (of course some more recent ones have recovered, and some earlier case are still active).
shk292: These graphs etc are very informative, but why is there a discrepancy between the Active Cases number above and the official number of 401? Or have I mis-read the graph?
These graphs etc are very informative, but why is there a discrepancy between the Active Cases number above and the official number of 401? Or have I mis-read the graph?
My graphs are derived from the spreadsheets published daily by MoH. These spreadsheets record the report date (presumably the onset of symptoms, or the date of a test) and various other data for every case. Unfortunately, MoH doesn't give a recovery date. So I make a guesstimate that 14 days is about the right time for recovery, and calculate "active at day N" as being the sum of new cases from day N-13 to day N. Some (most?) people will recover in 10 days, some will still be in hospital a month or more, so it's not very accurate. I'm sure the MoH has more accurate data, especially for hospitalizations, which they use to calculate their daily "active" count. But probably as a measure of how many active cases there are in the NZ population, it's still a bit uncertain.
Edit: Also, for the purposes of the "active" count, I include both "confirmed" and "probable" cases in my count. I don't know whether MoH does the same or not.
The current 'active cases' in NZ (401) are equivalent to the last 17 days of new cases.
For Taiwan, the gap between total cases and recovered cases is in the range 3 - 4 weeks; ie. their active cases correspond to the last 3 - 4 weeks of data. As at today it is the last 28 days of new cases.
In the case of Hong Kong, the current (22 Apr) active cases are equivalent to the last 23 days of new cases.
Possibly the latter two jurisdictions are a little more cautious about declaring people 'recovered'?
==
Re including both "confirmed" and "probable" cases in the active count, MOH surely do as some of the "probable" cases such as in the rest homes are never tested but are almost certainly positive for COVID-19.
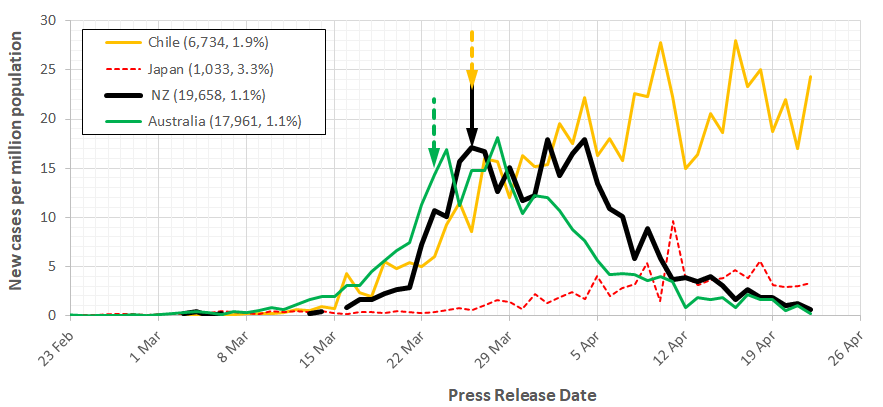
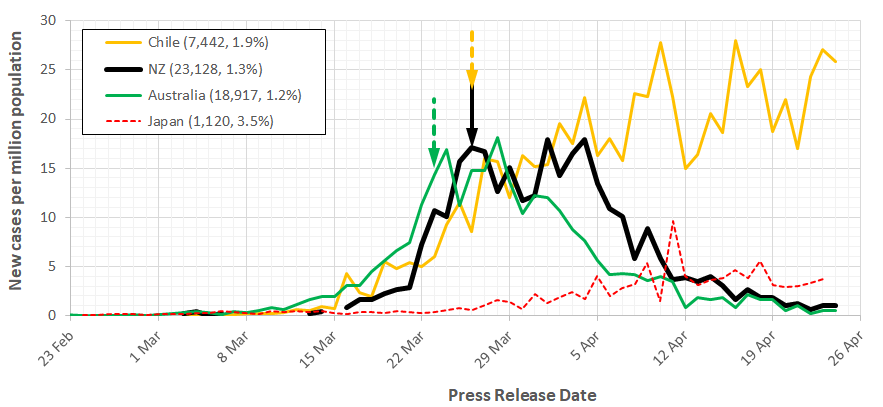
Update of plot with southern hemisphere countries + Japan for comparison. Plot is vs Press Release Date (-1?) and include imported and local cases.
NZ & AU now tracking very closely despite AU's more relaxed lockdown. AU actually lower. Forget their higher hospitalisation rate (resources). Death rate for the two now the same with NZ climbing, AU relatively stable.
Chile regional lockdown does no appear to be doing much, possibly a reflection of their lower test rate? (Have not checked if the rules for their lockdown have changed over the last 2 - 3 weeks)
Japan very little testing still likely reflected in their ~3x higher CFR-7. Still not full lockdown (I'm told by contacts there that by law the government cannot force people to stay at home)
Forgot to add that I have kept the three Greg Mortimer cases in the NZ total so have 3 new for today (they are here and imported). MOH have only removed them to avoid possible double up at WHO but that not really relevant here locally.
As discussed earlier, I've increased the "assumed active" period from 14 to 17 days. It's interesting (if you're truly a geek) that this change has added some bumps to the curve. I believe that's the weekly cycle manifesting itself... Sunday-Wednesday values include 2 weekends, whereas Friday has only 1, and Thursday and Saturday have 1.5. That applies for "active" values up to 20/4/20; from the 21st, I'm using the MoH "active" value instead of calculating it.
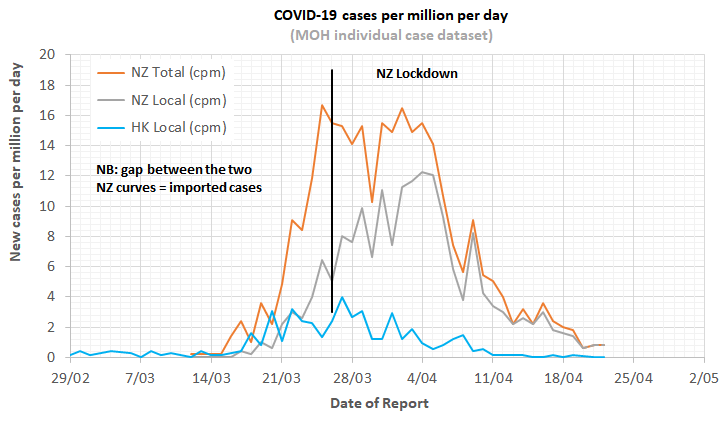
Update to plot comparing NZ to HK new local cases per day vs 'Date of Report' (NZ)/Date Confirmed (HK). Note that I have retained the 3 Greg Mortimer cases that MOH have (tentatively?) removed. However, those cases are from more than a week ago and are all imports so do not affect the NZ local cases.
Total for the 7 days to 22 Apr are: NZ local (= other than imported) = 50; HK local = 2 (1 'local', 1 'possibly local'). HK also had 19 imported cases.
So we still have a way to go. I see people saying we have a chance to become the first country to eliminate the virus. HK looks an awful lot closer to that than us (OK, not a 'country'!).
Again the headline announcement of 3 new cases at the press briefing gives a distorted view. The MOH individual case data show 3 new cases yesterday ('Date of Report' = 22 Apr), and 1 new on each of 20 & 21 Apr. That is 5 new (local) cases resulting in a flat trend over the last 3 days (also seen in frankv's plot)
The excess new cases over the last 3 days are compensated by +/-1 cases (net -2) from dates one to three weeks ago. But new cases over the last few days are what is relevant to our current situation.
"Morrison said he had discussed the possibility of easing stringent travel restrictions across the Tasman, as both countries were on "similar trajectories" in their response to Covid-19"
Per plot comparing the two countries, very similar at this point (#2468707).
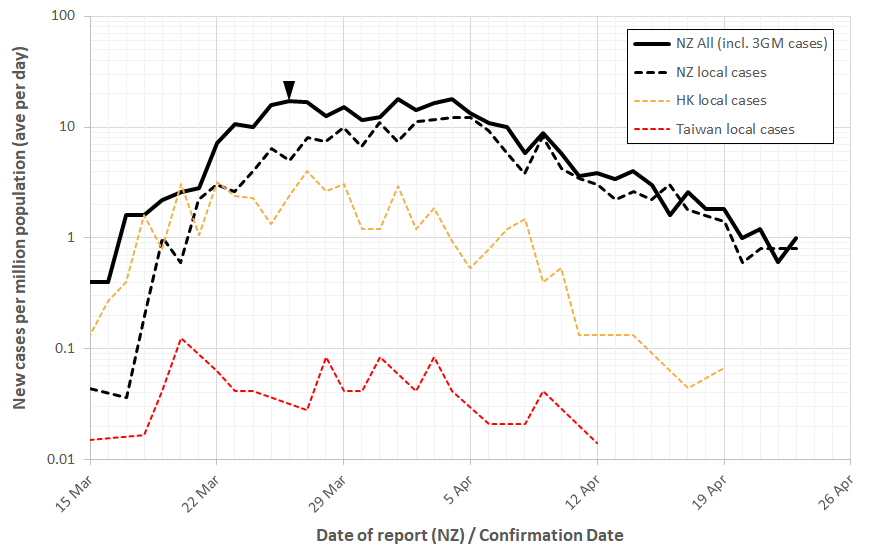
Update of NZ cases (today's release) vs HK local cases. Added Taiwan local cases. Note cases per million population plotted against 'Date or report' (NZ) / Confirmation date (HK & Taiwan)
- HK last local case was 5 days ago
- Taiwan last local case was 12 days ago
NZ per capita local cases effectively still two orders of magnitude above rate in Taiwan.
No, NZ will not be the first place to eradicate local CV19. Taiwan has already effectively done that though? Well, as near as can be to that state. Since it is still rampant in the world at large there will still be a risk of future isolated local cases cropping for a long time yet. But they seem to be on top of it. They have managed to contain the naval boat outbreak from a few days ago (tightly quarantined).
I think it best to not get hopes up that L3 should end after 2 weeks. We still have quite a way to go.
Update to the comparison with AU & Chile. These are total (local + imported) new cases per day vs Press Release Date. I do not have detailed data for AU & Chile so cannot separate local & imported in their daily figures. The close parallel between NZ & AU trends over the last 9 days is almost eerie. Almost an alternate day, rather than day of week / Easter effect???
Are you subscribed to our RSS feed? You can download the latest headlines and summaries from our stories directly
to your computer or smartphone by using a feed reader.