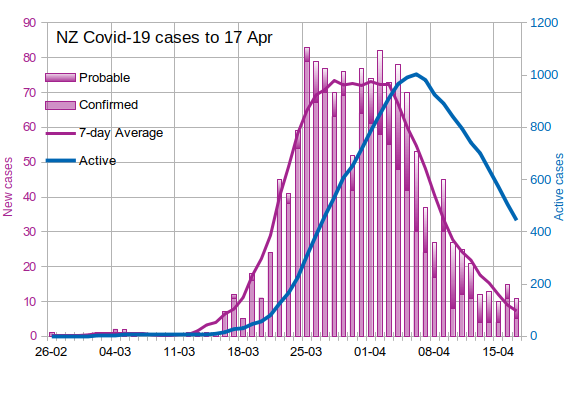
The following plot shows NZ new local cases confirmed each day up to yesterday (16 Apr). Be aware though that the figure for yesterday will be tentative (not all reports in?). Generally the 'yesterday' figure rises a bit (or more) over the following day or two.
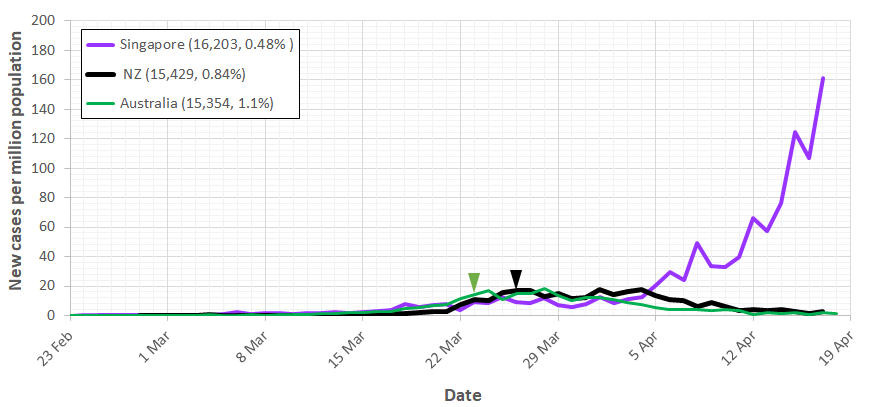
As indicated, our local cases confirmed each day have been flat at ~12 per day over the last four days. At 13, yesterdays was in fact the highest total over the four days. Note that in this plot the date is the 'Date of report' in the MOH individual case data (date when infection confirmed?), whereas the date in the plot in my previous post is the day before the date on which the data are released. Have to use that date as I do not have 'date of confirmation' for some of the countries.

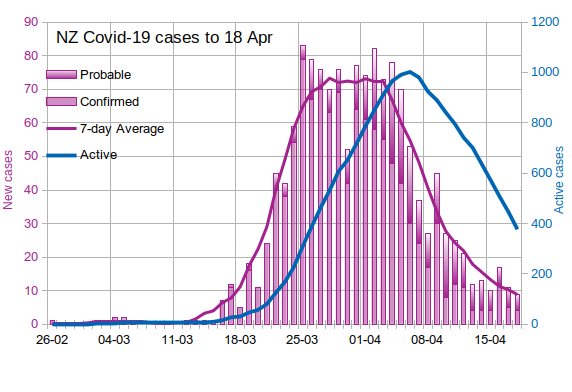
Small edit to make yesterdays number clearer and correct chart title.