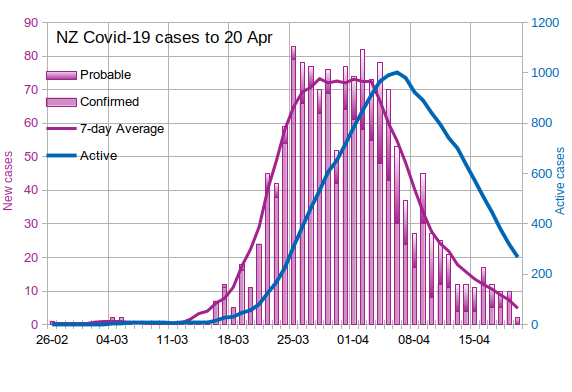
Well, this is a good news day. NO confirmed cases yesterday, just two probable. Of course, that may change retrospectively whenever today's tests' results come back. :)
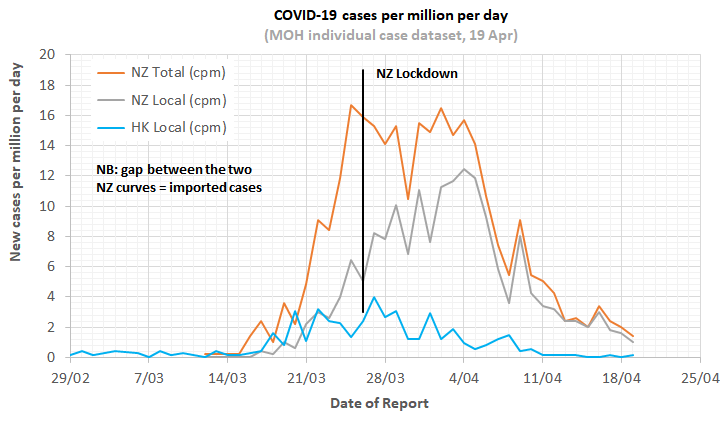
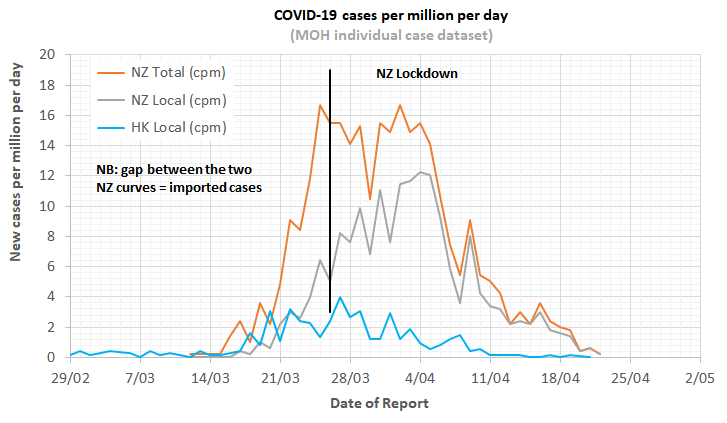
Note that the six new cases announced in the press briefing today included only 4 with a 'Date of report' being yesterday (3) or this morning (1). The other 2 cases were from 16 Apr and/or earlier dates (some +/- with net of +2). So down to just 3 (local & total) with a 'Date of report' = 21 Apr (yesterday). The 1 case for 'today' is just what MOH received before 9 am so will very likely change in tomorrows data.
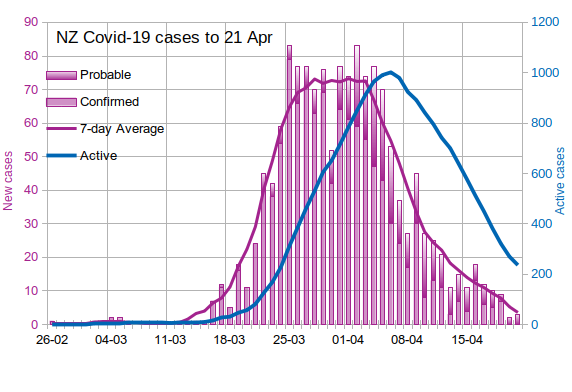
Second day of no new confirmed cases. :) I've made a small change; from now on the predicted cases are zero, for the purposes of calculating the last 4 points on the 7-day moving average graph.
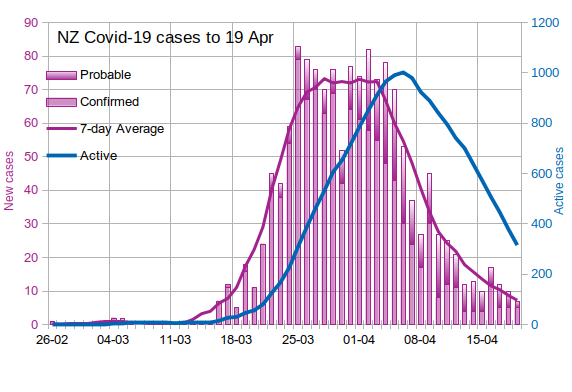
These graphs etc are very informative, but why is there a discrepancy between the Active Cases number above and the official number of 401? Or have I mis-read the graph?
These graphs etc are very informative, but why is there a discrepancy between the Active Cases number above and the official number of 401? Or have I mis-read the graph?
My graphs are derived from the spreadsheets published daily by MoH. These spreadsheets record the report date (presumably the onset of symptoms, or the date of a test) and various other data for every case. Unfortunately, MoH doesn't give a recovery date. So I make a guesstimate that 14 days is about the right time for recovery, and calculate "active at day N" as being the sum of new cases from day N-13 to day N. Some (most?) people will recover in 10 days, some will still be in hospital a month or more, so it's not very accurate. I'm sure the MoH has more accurate data, especially for hospitalizations, which they use to calculate their daily "active" count. But probably as a measure of how many active cases there are in the NZ population, it's still a bit uncertain.
Edit: Also, for the purposes of the "active" count, I include both "confirmed" and "probable" cases in my count. I don't know whether MoH does the same or not.
Paul1977: Where can you get historical data by region? I’d like to look at the case history in my local region but can only find the current numbers.
If your idea of your local region coincides with your DHB's district, then you're in luck... the spreadsheets downloadable from the MoH's website include the DHB district of each case, as well as the report date, so you can filter by district and count by date. Or, if you want to get fancy, do a pivot table.
Are you subscribed to our RSS feed? You can download the latest headlines and summaries from our stories directly
to your computer or smartphone by using a feed reader.