Geekzone: technology news, blogs, forums
Guest
Welcome Guest.
You haven't logged in yet. If you don't have an account you can register now.
Please note this sub-forum does not provide professional finance advice. You should seek advice from a licensed financial advisor.

To post in this sub-forum you must have made 100 posts or have Trust status or have completed our ID Verification.

If investing please consider our affiliate link for new accounts: Sharesies.


View this topic in a long page with up to 500 replies per page Create new topic
1 | ... | 6 | 7 | 8 | 9 | 10 | 11 
MikeAqua
7779 posts

Uber Geek


  #1793049 1-Jun-2017 12:39
Send private message

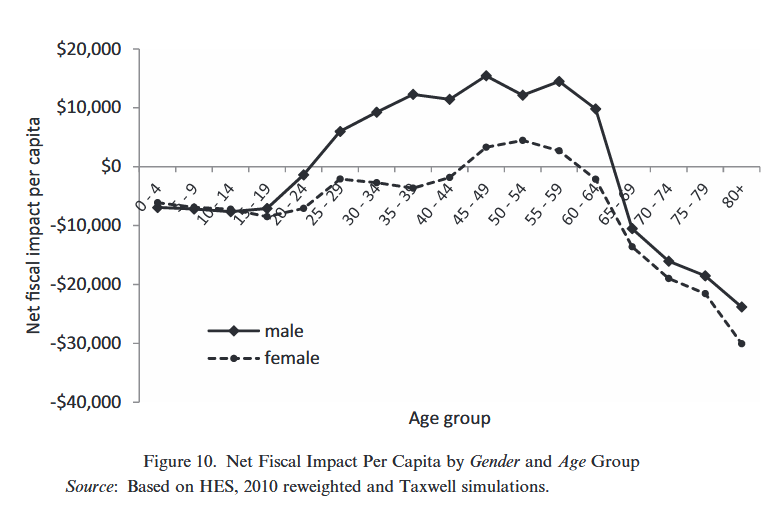
Reading the treasury report (which the bargraph comes from), it specifically defines fiscal impact as: services received minus tax paid. 


So a positive value means services received > tax paid


In the line graph: Kids (who use services but don't pay tax) have a negative fiscal impact. So a negative value must mean services received < tax payments


Mike


6FIEND
774 posts

Ultimate Geek
Inactive user


  #1793064 1-Jun-2017 13:07
Send private message

shk292:


Are those graphs opposite in sense?  Ie, the bottom one indicates that middle-aged men are strong net beneficiaries of the system if it's the same sense as the one above


Yes - the graphs are effectively opposites.   But your interpretation is back-to-front.  The bottom one indicates that middle-aged men are strong net contributors to the system, and benefit from it for a much lower percentage of their lifespan.


This graph is actually taken from the research report that the Treasury report was based on.  (ie. not the link provided in my first post)


Quote from the research:


Regions above the $0 line x-axis are cohorts that, on average, are paying more in tax than they are receiving in transfers and in services (valued at cost). They write:


The data illustrated in the figure suggest that, on average, males start having a positive net fiscal impact—per capita tax revenue exceeds the (allocated) expenditure they receive—in their early 20s. Women, on average, do not pass this “break even” point until their mid-40s. This is due to a combination of lower workforce participation, higher health and education spending, higher income support, and lower direct and indirect taxation.

A possible causal link may lie behind the high value of per capita education expenditure observed for women aged 30–44 and the lagged increase in per capita market income and direct tax for females in the 45–49 year age group. One possible hypothesis is that retraining during child-rearing years that precedes re-entry to the labor market results in an increase in market income and consequently higher direct taxation. The net effect of decreased education expenditure and increased direct taxation increases the net fiscal contribution of women in the 45–49 year old age group.


MikeAqua
7779 posts

Uber Geek


  #1793072 1-Jun-2017 13:18
Send private message

So are middle aged men: -


- Privileged over-earners?


- Beasts of burden everyone else is sponging off?


Mike


6FIEND
774 posts

Ultimate Geek
Inactive user


  #1793090 1-Jun-2017 13:47
Send private message

MikeAqua:


So are middle aged men: -


- Privileged over-earners?


- Beasts of burden everyone else is sponging off?


That's a matter of subjective opinion.


But the facts seem to suggest that they are the ones paying the $12, $18 & $59 share of the $100 bill in sen8or's analogy.


MikeAqua
7779 posts

Uber Geek


  #1793111 1-Jun-2017 14:00
Send private message

6FIEND:


MikeAqua:


So are middle aged men: -


- Privileged over-earners?


- Beasts of burden everyone else is sponging off?


That's a matter of subjective opinion.


But the facts seem to suggest that they are the ones paying the $12, $18 & $59 share of the $100 bill in sen8or's analogy.


Also fewer years on super for men.


Mike


shk292
2853 posts

Uber Geek

Lifetime subscriber

  #1793179 1-Jun-2017 15:16
Send private message

Thanks for the clarification - that all makes sense.  I couldn't work out why two "Y axes" with the same label were effectively opposit in sense though.


This confirms the commonly held "right wing" view about who are the net contributors


MikeAqua
7779 posts

Uber Geek


  #1793191 1-Jun-2017 15:23
Send private message

shk292:


Thanks for the clarification - that all makes sense.  I couldn't work out why two "Y axes" with the same label were effectively opposit in sense though.


This confirms the commonly held "right wing" view about who are the net contributors


If we focus on the cash flow and assume the benefits of social services are exclusively captured by their recipients.  I'm not sure that's true. 


For example the social welfare system could be argued to have a wider societal benefit. Society also benefits from kids being educated.


Mike


Shop now on AliExpress (affiliate link).
shk292
2853 posts

Uber Geek

Lifetime subscriber

  #1793198 1-Jun-2017 15:47
Send private message

MikeAqua:


shk292:


Thanks for the clarification - that all makes sense.  I couldn't work out why two "Y axes" with the same label were effectively opposit in sense though.


This confirms the commonly held "right wing" view about who are the net contributors


If we focus on the cash flow and assume the benefits of social services are exclusively captured by their recipients.  I'm not sure that's true. 


For example the social welfare system could be argued to have a wider societal benefit. Society also benefits from kids being educated.


Agreed - and as said above, I have no problem with the tax "burden" in NZ.  As a govt employee I don't have much of a leg to stand on anyway


Geektastic
17943 posts

Uber Geek

Trusted
Lifetime subscriber

  #1793363 1-Jun-2017 22:03
Send private message

6FIEND:


...if anyone is interested, the underlying data is also informative.


Eg. This prime example of "Middle Aged Male Privilege"


Anyone interested in the Treasury Report itself can find it here (courtesy of Victoria University)


Hey - where's this 'gender pay gap' they are always whining about?


Looks more like a 'gender contribution gap'....


1 | ... | 6 | 7 | 8 | 9 | 10 | 11 
View this topic in a long page with up to 500 replies per page Create new topic


News and reviews »

Air New Zealand Starts AI adoption with OpenAI
Posted 24-Jul-2025 16:00


eero Pro 7 Review
Posted 23-Jul-2025 12:07


BeeStation Plus Review
Posted 21-Jul-2025 14:21


eero Unveils New Wi-Fi 7 Products in New Zealand
Posted 21-Jul-2025 00:01


WiZ Introduces HDMI Sync Box and other Light Devices
Posted 20-Jul-2025 17:32


RedShield Enhances DDoS and Bot Attack Protection
Posted 20-Jul-2025 17:26


Seagate Ships 30TB Drives
Posted 17-Jul-2025 11:24


Oclean AirPump A10 Water Flosser Review
Posted 13-Jul-2025 11:05


Samsung Galaxy Z Fold7: Raising the Bar for Smartphones
Posted 10-Jul-2025 02:01


Samsung Galaxy Z Flip7 Brings New Edge-To-Edge FlexWindow
Posted 10-Jul-2025 02:01


Epson Launches New AM-C550Z WorkForce Enterprise printer
Posted 9-Jul-2025 18:22


Samsung Releases Smart Monitor M9
Posted 9-Jul-2025 17:46


Nearly Half of Older Kiwis Still Write their Passwords on Paper
Posted 9-Jul-2025 08:42


D-Link 4G+ Cat6 Wi-Fi 6 DWR-933M Mobile Hotspot Review
Posted 1-Jul-2025 11:34


Oppo A5 Series Launches With New Levels of Durability
Posted 30-Jun-2025 10:15


Geekzone Live »

Try automatic live updates from Geekzone directly in your browser, without refreshing the page, with Geekzone Live now.


Are you subscribed to our RSS feed? You can download the latest headlines and summaries from our stories directly to your computer or smartphone by using a feed reader.