|
|
|
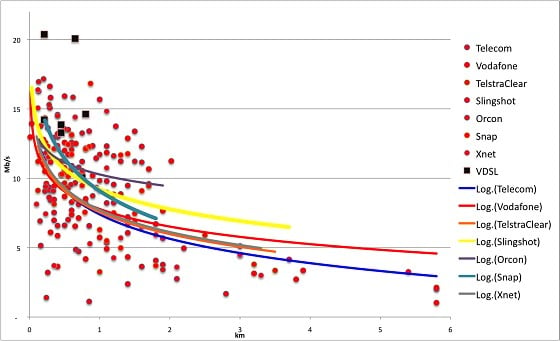
nickt: JohnButt, great to see this data but I have questions too (pesky geeks!). Why does the 'Speed by time of day' graph not go lower than 80% ? Enquiring minds want to know just how woeful TelstraClear ADSL is between 5 and 11pm.
How do I reconcile the great consistency of Snap with their slow page loads ? I expect people will say "it's the transparent proxies on the big ISPs", so does the Webpage Download test deliberately cache bust when it makes the request ? Sure, normal users don't do that but it would be great to do two tests, and compare apparent and raw pageload times. How does this all fit with the tests described in https://www.truenet.co.nz/how-does-it-work
Ragnor: +1 for changing the cable results from advertised/marketing speed to measured maximum speed like the rest of the results.
"I was born not knowing and have had only a little time to change that here and there." | Octopus Energy | Sharesies
- Richard Feynman
sidefx:Ragnor: +1 for changing the cable results from advertised/marketing speed to measured maximum speed like the rest of the results.
Then to hold their position at the "top" they could just artificially limit all customers to their advertised speeds and hey presto they have 100% all the time...
NonprayingMantis:
and that would be absolutely fine since then it would a genuine comparison
"I was born not knowing and have had only a little time to change that here and there." | Octopus Energy | Sharesies
- Richard Feynman
sidefx:NonprayingMantis:
and that would be absolutely fine since then it would a genuine comparison
See IMHO that would just skew the results in the opposite direction; given that ADSL is usually advertised as "Maximum speed" (whatever your line supports) whereas cable is advertised as "Up to 15/2" and the graph is an attempt to show if you're "getting what you pay for" I think in some ways it's fair enough as is... though one could argue it's also comparing apples and oranges (analogue v digital) and perhaps the cable\fibre providers should be on a seperate graph.
TBH, just an explanation as John has proposed would make just as much sense...

Please note all comments are from my own brain and don't necessarily represent the position or opinions of my employer, previous employers, colleagues, friends or pets.
JohnButt: Thanks Talkiet, you have just suggested a very good solution. We are gathering 100Mb/s Cable from existing probes (we recognize them quickly :-) and have accepted a few new, however we are having to work on a new probe for them so will not be ready for a while, however we also have some fibre, and these have speeds all over the place, depending on the chosen speed mostly. Hence a separate chart makes a lot of sense fro technologies where the speed is selected.
Please note all comments are from my own brain and don't necessarily represent the position or opinions of my employer, previous employers, colleagues, friends or pets.
The little things make the biggest difference.
LennonNZ: If TCL "advertise" 15M and customers are getting more.. then shouldn't this be a fault?
insane: This is why people have been saying that you cannot look at speed and consistency separately, they need to be looked at together, and the 100% point for any given probe needs to be the max speed that probe has ever achieved, not the line speed.

|
|
|
