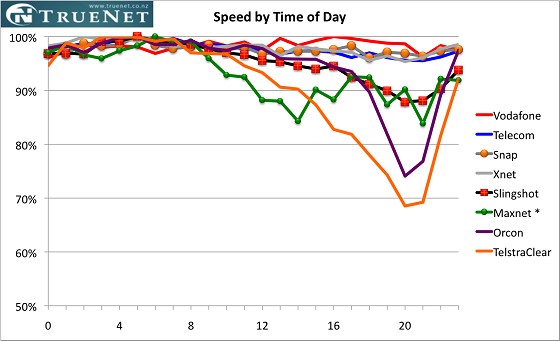
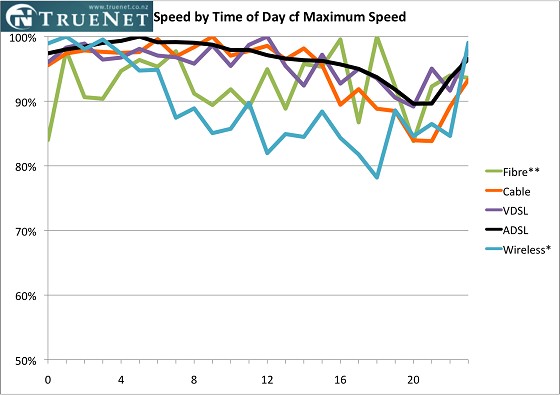
Geekzone: technology news, blogs, forums
Guest
Welcome Guest.
You haven't logged in yet. If you don't have an account you can register now.


View this topic in a long page with up to 500 replies per page Create new topic
1 | 2 | 3 | 4 | 5 
SamF
1578 posts

Uber Geek

Trusted

  #641840 16-Jun-2012 16:18
Send private message

JohnButt:
insane: This is why people have been saying that you cannot look at speed and consistency separately, they need to be looked at together, and the 100% point for any given probe needs to be the max speed that probe has ever achieved, not the line speed.

Exactly how we do this comparison.  Cool


I think he means that effectively no provider should rate at over 100%...


Sounddude
I fix stuff!
1928 posts

Uber Geek

Trusted
2degrees
Lifetime subscriber

  #641842 16-Jun-2012 16:22
Send private message

JohnButt:
insane: This is why people have been saying that you cannot look at speed and consistency separately, they need to be looked at together, and the 100% point for any given probe needs to be the max speed that probe has ever achieved, not the line speed.


Exactly how we do this comparison.  Cool


If you were doing it that way, then TCL Cable would be 100%, not the 120% you are showing.

(My View, not my employers)

LennonNZ
2459 posts

Uber Geek

ID Verified
Trusted

  #641846 16-Jun-2012 16:33
Send private message

Is there a explanation of technically how you do these tests and where/what the test points are?

I can't seem to find it anywhere.

Depending on how you test/where you test to you may bias (not on purpose) a certain ISPs results.


insane
3240 posts

Uber Geek

ID Verified
Trusted

  #642236 17-Jun-2012 21:32
Send private message

JohnButt:
insane: This is why people have been saying that you cannot look at speed and consistency separately, they need to be looked at together, and the 100% point for any given probe needs to be the max speed that probe has ever achieved, not the line speed.


Exactly how we do this comparison.  Cool


As others have pointed above this is not how you are doing it, and the monthly graphs you create proves it.

It may work that way for ADSL, but who cares about only ADSL, the test HAS to be relevant independent of access method, and has to be bound by the same rules if you're to place the results on the same set of axis. 

I'm not knocking your effort you put into getting the test results, just start representing the data accurately or accept that others will re-create your graphs each month to tell the real story.

DonGould
3892 posts

Uber Geek


  #642287 17-Jun-2012 23:40
Send private message

Ya, I agree with many of the people here.

John you know I'm a huge fan of what you're doing. But I have to say that I don't feel like TCL are being represented in the same light as others.

I agree with others, why does the graph not start at 0. Why doesn't it show just how poor TCL DSL got? Why does it cut off at 80%?

Is this the treatment that other providers can expect to get when they start delivering UFB?

If I become a UFB provider and market my 100/50 product as 80/40 and then price it at a premium, will I then show up as constantly 120% when it runs at 100/50?

Is this what this whole debate is really about? Are you thinking ahead for UFB and setting the stage for more representative marketing of products?

Are you suggesting that DSL providers should be marketing their product as 10/1 only (as that's the fault condition isn't it?) and then their services can then be more clearly and simply understood by consumers?

Again, you and everyone knows I'm a mad fan of what you've been doing, but I am left with questions about transparency at present and I don't like that feeling.


D


Promote New Zealand - Get yourself a .kiwi.nz domain name!!!

Check out mine - i.am.a.can.do.kiwi.nz - don@i.am.a.can.do.kiwi.nz


Ragnor
8223 posts

Uber Geek

Trusted

  #642428 18-Jun-2012 11:23
Send private message

Yep Cable doesn't need a special methodology where 100% = advertised speed (rather than max measured speed).

Surely every access method (ADSL, Cable, RBI Wireless, Mobile, VDSL, UFB) should use the same methodology ie: max measured speed = 100%.


JohnButt

374 posts

Ultimate Geek

Trusted

  #644398 21-Jun-2012 18:13
Send private message

After a long delay while I crushed the numbers, here is a useful proposal for discussion, three charts that I could use for future publications.  

* A couple of notes, we do not have enough Fibre or Wireless probes for the data to be reliable.  

**The fibre speed is an average of the probes we have running, but since each probe speed is chosen from a wide range of speeds on offer, the average has little meaning apart from being close to the average of the choices our volunteers have made.

We are also only plotting 15MB/s Cable.  

Feedback welcome Laughing  PM or here

First, the same chart as before, but for ADSL only


Second, a technology chart based on maximum speed


Third, a chart to show actual speeds by technology


I have stuck to the suppressed zero.  This is for two reasons
  1. The speed is an average at each hour for a whole month and for multiple probes, it would be too hard to read if I were to show the variations about this average, but if your average speed drops to say 80% of peak, then it is very likely that the lower bounds of your speed will be in an unusable range.  
  2. Thus the impact of average speed loss is non-linear, and suggesting that average speed could drop below 50% is a nonsense, because the variation would take the lower bounds down to some "unacceptable" level (& unacceptable defined differently by each person).  i.e. how often is an unusable performance acceptable, 10% of the time? 50% of the time?  Averages cannot show this.
Comments on this choice would be interesting as well.


Trade NZ and US shares and funds with Sharesies (affiliate link).
SamF
1578 posts

Uber Geek

Trusted

  #644412 21-Jun-2012 18:48
Send private message

Some interesting data there, however I'm not sure that there's much value in comparing technologies as the limitations & relative capacities of these are fairly static and any variation tends to be due to provisioning and capacity limitations of individual ISPs.

1 | 2 | 3 | 4 | 5 
View this topic in a long page with up to 500 replies per page Create new topic


News and reviews »

Air New Zealand Starts AI adoption with OpenAI
Posted 24-Jul-2025 16:00


eero Pro 7 Review
Posted 23-Jul-2025 12:07


BeeStation Plus Review
Posted 21-Jul-2025 14:21


eero Unveils New Wi-Fi 7 Products in New Zealand
Posted 21-Jul-2025 00:01


WiZ Introduces HDMI Sync Box and other Light Devices
Posted 20-Jul-2025 17:32


RedShield Enhances DDoS and Bot Attack Protection
Posted 20-Jul-2025 17:26


Seagate Ships 30TB Drives
Posted 17-Jul-2025 11:24


Oclean AirPump A10 Water Flosser Review
Posted 13-Jul-2025 11:05


Samsung Galaxy Z Fold7: Raising the Bar for Smartphones
Posted 10-Jul-2025 02:01


Samsung Galaxy Z Flip7 Brings New Edge-To-Edge FlexWindow
Posted 10-Jul-2025 02:01


Epson Launches New AM-C550Z WorkForce Enterprise printer
Posted 9-Jul-2025 18:22


Samsung Releases Smart Monitor M9
Posted 9-Jul-2025 17:46


Nearly Half of Older Kiwis Still Write their Passwords on Paper
Posted 9-Jul-2025 08:42


D-Link 4G+ Cat6 Wi-Fi 6 DWR-933M Mobile Hotspot Review
Posted 1-Jul-2025 11:34


Oppo A5 Series Launches With New Levels of Durability
Posted 30-Jun-2025 10:15


Geekzone Live »

Try automatic live updates from Geekzone directly in your browser, without refreshing the page, with Geekzone Live now.


Are you subscribed to our RSS feed? You can download the latest headlines and summaries from our stories directly to your computer or smartphone by using a feed reader.