Geekzone: technology news, blogs, forums
Guest
Welcome Guest.
You haven't logged in yet. If you don't have an account you can register now.


prob

225 posts

Master Geek


#317679 5-Nov-2024 11:56
Send private message

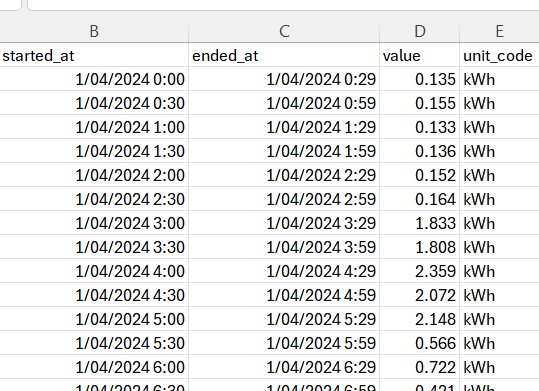
My electricity company doesn't have any usage stat's on line, but on request will send me a excel spreadsheet with usage over time.


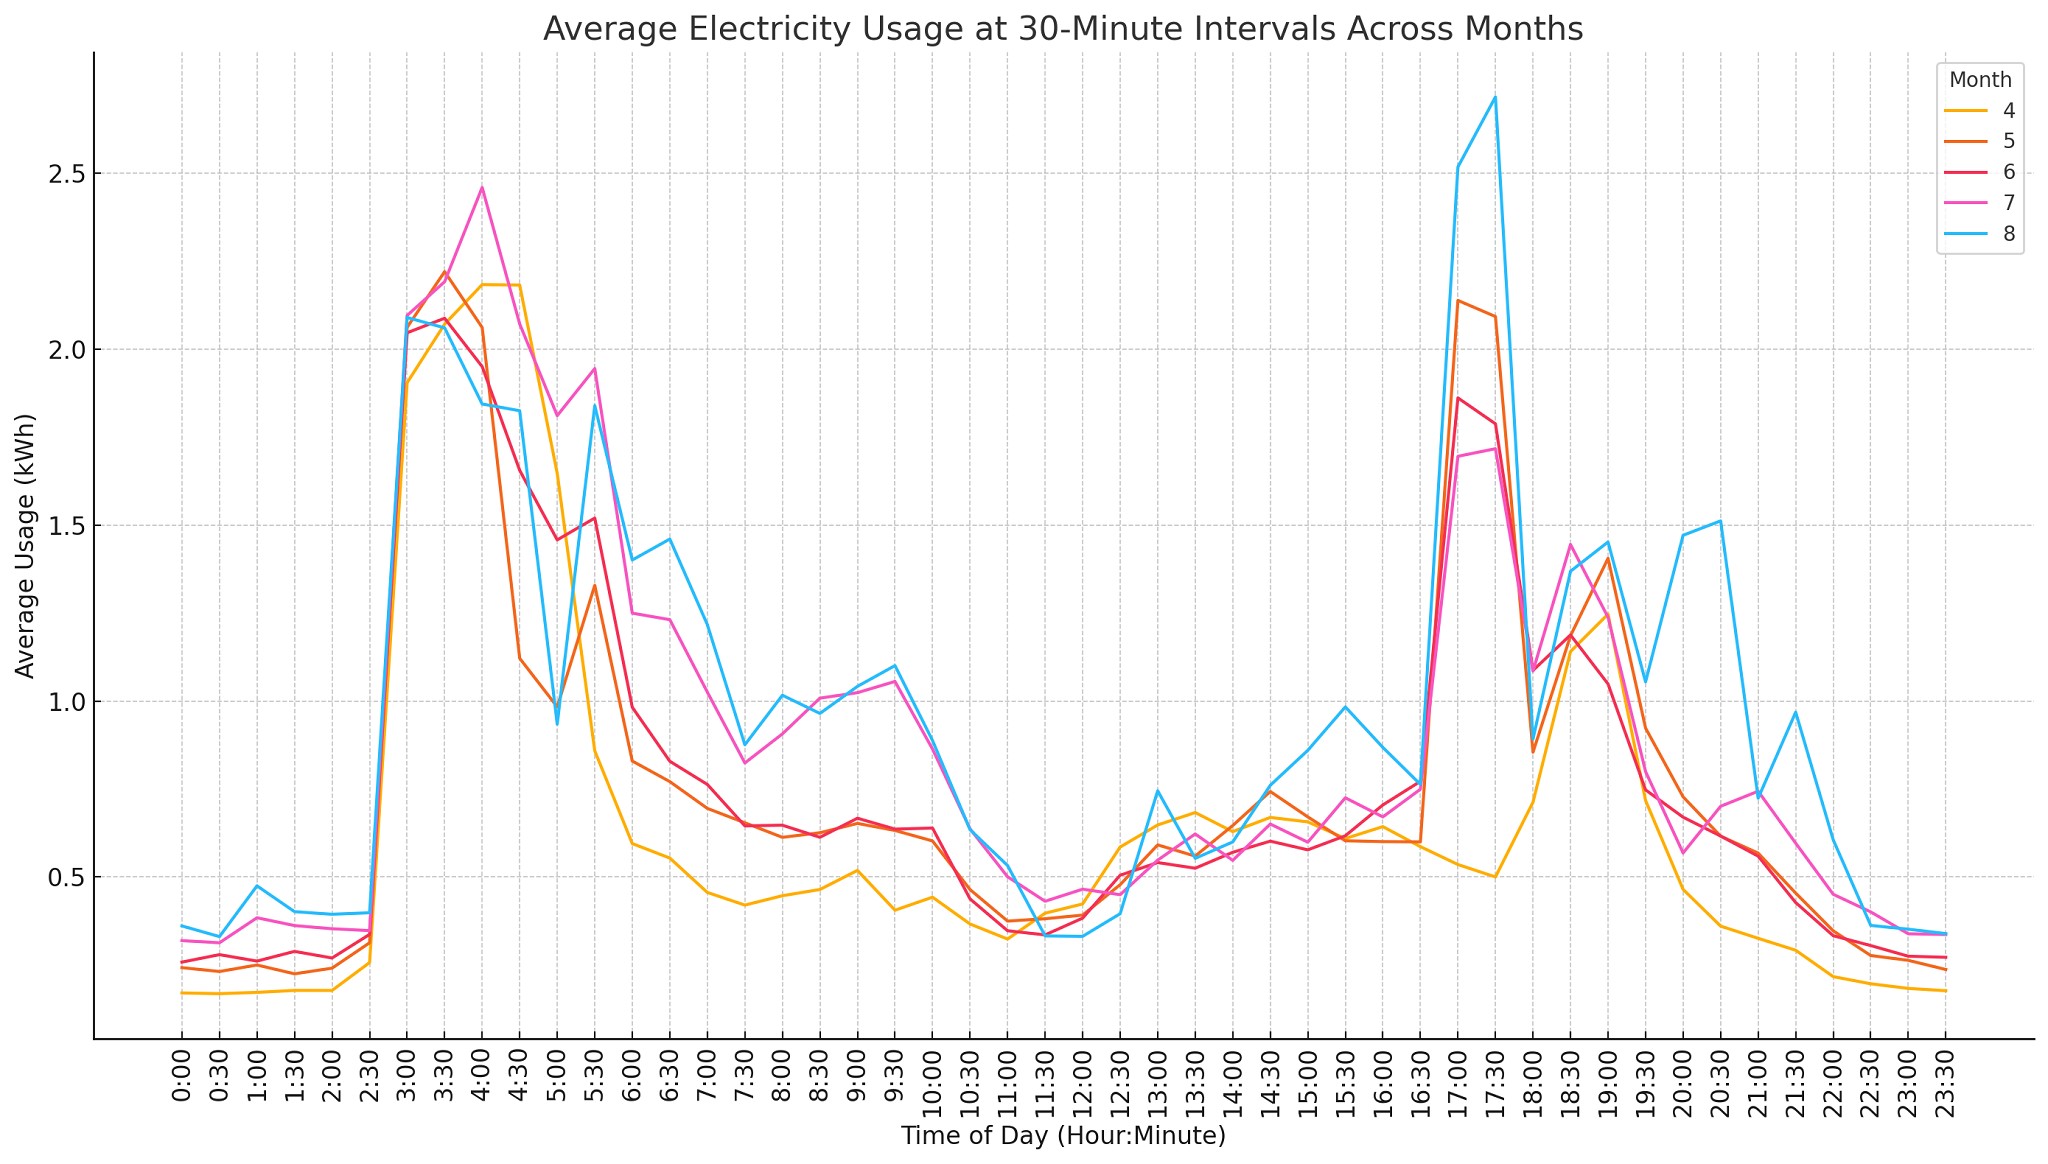
Its my half hourly usage and I want to graph it in a visually useful way so I can work out how many solar panels to get. 


This is probably an Excel question, but any suggestions?


Create new topic
Valok
38 posts

Geek


  #3305554 5-Nov-2024 13:33
Send private message

try dragging the info into chatgpt


fastbike
212 posts

Master Geek


  #3305638 5-Nov-2024 16:29
Send private message

I went through a modelling exercise before we installed solar.


I had consumption data at 2 min intervals across 3 phases from a real time meter I got installed a year ago (iammeter.com). I also had access to a reasonable close by solar pv installation and got the owner's permission to pull down a year's worth of production data, in 15 min intervals. I converted my consumption data to 15 min intervals so could build a model with 96 data points per day to see if that slot was a net import or export and then apply the relevant tariffs (day/night/feed in etc) from a variety of power plans.


I also used data from Niwa SolarView to apply a correction factor to the production data to take account of size/orientation/tilt so I had more realistic production data for our planned installation.


If you only have data at 30 min intervals your mileage may vary as the production can fluctuate a lot during even a 15 min interval.


I'd see if you can find  a site closeby that has a portal which is public and run with that


Otautahi Christchurch


  #3305651 5-Nov-2024 17:42
Send private message

30 mins is quite coarse but if that's all you have that's all you have.


the started at and ended at fields suck as they have both date and time in them and its hard to graph those.


prob

225 posts

Master Geek


  #3305921 6-Nov-2024 15:58
Send private message

Thanks for the suggestions. ChatGPT helped me out. See as follows. I have free power from 3 to 6. I have a timer on my hot water and I see that it is kicking in at 2:30am rather than 3am so I will need to fix that.


I will get some more data but it is helpful to see the peaks and troughs. 


RunningMan
8953 posts

Uber Geek


  #3306005 6-Nov-2024 18:06
Send private message

Looks like the usage peaks at 3.00am not 2.30am. Timer looks fine. Remember that is a 30 minute window starting at that time - a bar graph would have been a better representation. The 2.30 usage it about 0.5 kWh and the 3.00 usage 3 kWh, so presumably you have a 3kW load kicking in at 3.00 which would be the water heater.


ANglEAUT
2320 posts

Uber Geek

Trusted
Lifetime subscriber

  #3306199 6-Nov-2024 21:15
Send private message

Good to see you get a graph started. 


I wanted to warn you yesterday about using the 'started_at' column for your chart axis. I believe that is the cause for your 02:30 / 03:00 confusion with the HWC. Rather use the 'ended_at' column for this. For me, that has always brought the usage into the correct "block" of time. 


Next, consider adding additional columns to your data. See the screenshot below for an example of the result. They could be


  • Day_of_the_week (Mon,Tue, ...)
  • Week # ( either 1st date of the week as per screenshot below, or Week 1, Week 2, ...)
  • Month #


    • With the 3 columns above, you can look at additional timelines & trends of your usage
  • consider an additional column that combines the 2half hour cells into a full hour cell. I believe it will be easier to think & speak about that hour period instead of having to do some mental arithmetic to get a full hours use.
  • $ cost of kWh at that time of day
  • $ cost of used electricity at that time of day


    • These two columns will be helpful when you start our 'what if' scenarios because you will consider shifting your early morning & dinner time peaks to the middle of the day during peak solar production time
  • if you use the 'ended_at' column for your chart axis, you can easily create an additional column that shows the date / time in your desired format & us that for the axis.
  • if you really want to geek out, consider adding a 'power conversion / loss' column


    • if I use X kWh in this time slot, my panel has to produce X +/- conversion factor to cover my usage
  • if you really want to geek out, consider adding a 'correction factor' column (see comment by fastbike above) for the efficiency of your panels


In addition to using graphs, consider applying a heat map conditional formatting on your tables. This will aid your understanding of the relative value of the number that you see in the actual cell.


Please keep this GZ community vibrant by contributing in a constructive & respectful manner.


prob

225 posts

Master Geek


  #3306603 7-Nov-2024 13:50
Send private message

OP here. I will ask Chapgpt to make suggested changes. I checked timer on hot water to find it has not adjusted for Daylight Saving so that has been a helpful result of me checking my usage. I will check again tomorrow but I still think that the time is starting 30 mins too early. This is important because that's when my power usage peaks and I want to get that to coincide with free power.


Cloud spending continues to surge globally, but most organisations haven’t made the changes necessary to maximise the value and cost-efficiency benefits of their cloud investments. Download the whitepaper From Overspend to Advantage now.
RunningMan
8953 posts

Uber Geek


  #3306703 7-Nov-2024 19:12
Send private message

Just check the actual data, that will tell you where the usage actually is.


Create new topic


News and reviews »

Air New Zealand Starts AI adoption with OpenAI
Posted 24-Jul-2025 16:00


eero Pro 7 Review
Posted 23-Jul-2025 12:07


BeeStation Plus Review
Posted 21-Jul-2025 14:21


eero Unveils New Wi-Fi 7 Products in New Zealand
Posted 21-Jul-2025 00:01


WiZ Introduces HDMI Sync Box and other Light Devices
Posted 20-Jul-2025 17:32


RedShield Enhances DDoS and Bot Attack Protection
Posted 20-Jul-2025 17:26


Seagate Ships 30TB Drives
Posted 17-Jul-2025 11:24


Oclean AirPump A10 Water Flosser Review
Posted 13-Jul-2025 11:05


Samsung Galaxy Z Fold7: Raising the Bar for Smartphones
Posted 10-Jul-2025 02:01


Samsung Galaxy Z Flip7 Brings New Edge-To-Edge FlexWindow
Posted 10-Jul-2025 02:01


Epson Launches New AM-C550Z WorkForce Enterprise printer
Posted 9-Jul-2025 18:22


Samsung Releases Smart Monitor M9
Posted 9-Jul-2025 17:46


Nearly Half of Older Kiwis Still Write their Passwords on Paper
Posted 9-Jul-2025 08:42


D-Link 4G+ Cat6 Wi-Fi 6 DWR-933M Mobile Hotspot Review
Posted 1-Jul-2025 11:34


Oppo A5 Series Launches With New Levels of Durability
Posted 30-Jun-2025 10:15


Geekzone Live »

Try automatic live updates from Geekzone directly in your browser, without refreshing the page, with Geekzone Live now.


Are you subscribed to our RSS feed? You can download the latest headlines and summaries from our stories directly to your computer or smartphone by using a feed reader.