Geekzone: technology news, blogs, forums
Guest
Welcome Guest.
You haven't logged in yet. If you don't have an account you can register now.
Please note this sub-forum does not provide professional finance advice. You should seek advice from a licensed financial advisor.

To post in this sub-forum you must have made 100 posts or have Trust status or have completed our ID Verification.

If investing please consider our affiliate link for new accounts: Sharesies.


ockel

2031 posts

Uber Geek
+1 received by user: 545


#311541 25-Jan-2024 15:21

Melville Jessop Weaver Investment Survey for the December quarter has been released.  


A link for any interested https://mjw.co.nz/wp-content/uploads/2024/01/MJW-Investment-Survey-Dec-2023.pdf 


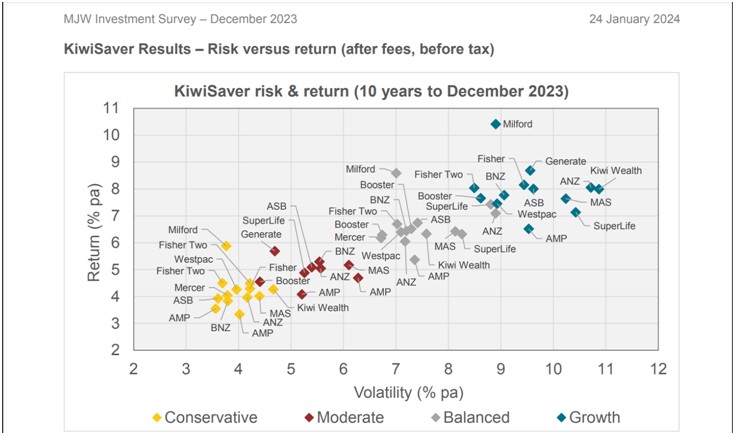
And the Risk/Return graph for the 10 year period for judging your manager against all others in your appropriate risk class.  If there is a demand for the 5 yr graphs I'll post them.


Filter this topic showing only the reply marked as answer Create new topic
mattwnz
20515 posts

Uber Geek
+1 received by user: 4795


  #3186479 25-Jan-2024 15:31
Send private message

I do wonder why AMPs return % is at or near the bottom for all 4.


mudguard
2327 posts

Uber Geek
+1 received by user: 1250


  #3186482 25-Jan-2024 15:35
Send private message

Good old Kiwi Wealth. I don't even know who owns it now as it's changed hands a couple of times. I've left the residual amount in a growth fund as I took virtually all of it out to buy a house.

I remember way back Gareth Morgan wouldn't share their numbers as I think his members got their reports in dollar terms whereas many others were reporting in 'units' which he disagreed with.

It must've changed.

jonathan18
7415 posts

Uber Geek
+1 received by user: 2850

ID Verified
Trusted

  #3186492 25-Jan-2024 16:27
Send private message

mudguard: Good old Kiwi Wealth. I don't even know who owns it now as it's changed hands a couple of times. I've left the residual amount in a growth fund as I took virtually all of it out to buy a house.

I remember way back Gareth Morgan wouldn't share their numbers as I think his members got their reports in dollar terms whereas many others were reporting in 'units' which he disagreed with.

It must've changed.


IIRC it’s now owned by Fisher Funds. I’ve shifted my kids’ schemes from Kiwi Wealth (to Simplicity), much like I shifted my own scheme from them (to Milford) at some point after they took over GMI. The kids still have some money in Kiwi Wealth’s managed funds, which are doing swimmingly (/s)…


cshwone
1092 posts

Uber Geek
+1 received by user: 847


  #3186516 25-Jan-2024 18:01
Send private message

How do you read that graph. Yep I get the Y axis, but what does the x-axis actually mean and is it actually relevant?


Jase2985
13730 posts

Uber Geek
+1 received by user: 6202

ID Verified
Lifetime subscriber

  #3186526 25-Jan-2024 18:47
Send private message

cshwone:


How do you read that graph. Yep I get the Y axis, but what does the x-axis actually mean and is it actually relevant?


X is how risky the investment is, given they are high growth they are more risky, and tend to be more volatile in their returns, sometimes having some good ups, but other times they might have some low or even negative returns. The closer to zero you get the more conservative you get where there is less year-on-year fluctuation but with that comes less returns.


What you have to remember is if you are young you are in it for the long haul so while you might have a year or 2 that are low return, look at the long term, which is what that graph is showing, which is the 10-year return which for the growth funds is anywhere from 6.5% to 10.5% per annum.


cshwone
1092 posts

Uber Geek
+1 received by user: 847


  #3186556 25-Jan-2024 20:13
Send private message

Jase2985:


cshwone:


How do you read that graph. Yep I get the Y axis, but what does the x-axis actually mean and is it actually relevant?


X is how risky the investment is, given they are high growth they are more risky, and tend to be more volatile in their returns, sometimes having some good ups, but other times they might have some low or even negative returns. The closer to zero you get the more conservative you get where there is less year-on-year fluctuation but with that comes less returns.


What you have to remember is if you are young you are in it for the long haul so while you might have a year or 2 that are low return, look at the long term, which is what that graph is showing, which is the 10-year return which for the growth funds is anywhere from 6.5% to 10.5% per annum.


Thank you, a great explanation and totally get it now.


Support Geekzone with one-off or recurring donations Donate via PressPatron.
Lightbulb
119 posts

Master Geek
+1 received by user: 10

ID Verified
Lifetime subscriber

  #3188932 31-Jan-2024 19:30
Send private message

mattwnz:


I do wonder why AMPs return % is at or near the bottom for all 4.


and Milford is near the top for theirs


Filter this topic showing only the reply marked as answer Create new topic


Geekzone Live »

Try automatic live updates from Geekzone directly in your browser, without refreshing the page, with Geekzone Live now.


Are you subscribed to our RSS feed? You can download the latest headlines and summaries from our stories directly to your computer or smartphone by using a feed reader.