Geekzone: technology news, blogs, forums
Guest
Welcome Guest.
You haven't logged in yet. If you don't have an account you can register now.


chevrolux

4962 posts

Uber Geek
Inactive user


#239825 6-Aug-2018 18:30
Send private message

Sticking this in here because my use is for home automation.


So I am just not getting anywhere with Grafana. I have node-red feeding sensor data in to influxdb, and now I just want to make a pretty graph in Grafana.


I've double checked the data is in influxdb by just using the CLI and do a query 'SELECT * FROM StudyTemp'.


The 'Data Sources' thing in Grafana says the data source for influxdb is working.


But then I come to make a graph, and that stupid click and drag query thing just isn't doing what I want/I don't know what i want it to do.


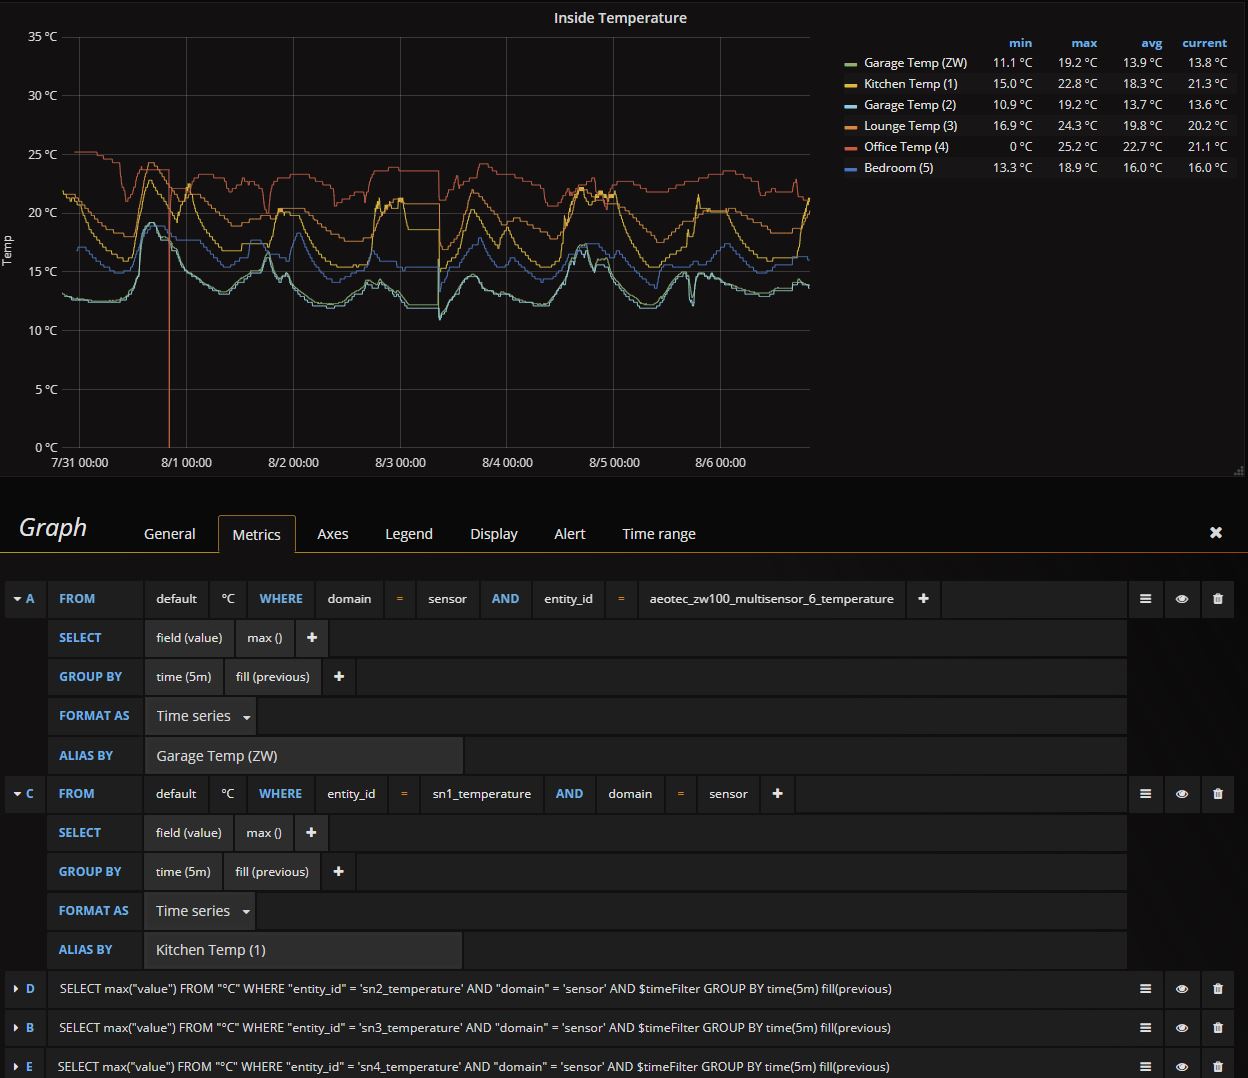
So all I want to know, is how do I fill this in to make a nice graph of my 'StudyTemp' data...


Have worked out, obviously, that select measurement gets set to StudyTemp. But then I don't need any 'where' statements as far as I'm concerned because I just want all of it.


And yes, I know there is heaps of info out there but have been sifting through it all weekend and really got no where - they seem to be mostly aimed at just the set up of the system and not actually about displaying data.


Create new topic
amanzi
Amanzi
1299 posts

Uber Geek

ID Verified
Trusted
Lifetime subscriber

  #2068904 6-Aug-2018 18:34
Send private message

I struggled at first with Grafana, but this article helped me https://philhawthorne.com/getting-started-with-grafana-influxdb-for-home-assistant/


Talkiet
4793 posts

Uber Geek

Trusted

  #2068937 6-Aug-2018 20:06
Send private message

I haven't looked at yours in detail, but I do the same thing and this is what my setup looks like.


Cheers - N


Please note all comments are from my own brain and don't necessarily represent the position or opinions of my employer, previous employers, colleagues, friends or pets.


chevrolux

4962 posts

Uber Geek
Inactive user


  #2068957 6-Aug-2018 20:36
Send private message

How do you put your data in to influxdb? Specifically, where does that 'domain' and 'entity_id' stuff come from. When I look at the influxdb table it's just two columns (timestamp and data), so I'm not sure what else I can select on?


For background, I made that multisensor from Bruh automation (same as your sensors I think). Only difference is I'm running the ESP Easy firmware instead of that Arduino sketch of Bruh's.


To get the temperature though node-red just needs to monitor the MQTT topic for it (/esp05/temp_humid/temp), and then pipes that straight in to an influxdb node. The only option I have for that is influxdb node is to set the 'Measurement' field which is where the 'StudyTemp' thing comes from.


Talkiet
4793 posts

Uber Geek

Trusted

  #2068959 6-Aug-2018 20:41
Send private message

Hmm. let me try and remember... My sensors are MQTT and are using the arduino sketch. My influx DB has lots of other stuff in it as well, and multiple sensors - so those fields just restrict (maybe needlessly) to the entity of interest.


Homeassistant reads he sensors and shoves the data into influxDB


Cheers - N


Please note all comments are from my own brain and don't necessarily represent the position or opinions of my employer, previous employers, colleagues, friends or pets.


amanzi
Amanzi
1299 posts

Uber Geek

ID Verified
Trusted
Lifetime subscriber

  #2068961 6-Aug-2018 20:44
Send private message

The "select measurement" field needs to be set to the units you want, i.e. the degrees symbol for temperature. Look at the screenshot above, or follow the instructions in the link I posted.

amanzi
Amanzi
1299 posts

Uber Geek

ID Verified
Trusted
Lifetime subscriber

  #2068963 6-Aug-2018 20:59
Send private message

Here's a basic example to create a temperature graph.


You need to change the "select measurement" field to the units relevant to what you're want to graph, then choose the correct entity_id, then change the 'group by' field so that it says 'fill(none)'.


mentalinc
3239 posts

Uber Geek

Trusted

  #2068965 6-Aug-2018 21:10
Send private message

click "select measurement" and then from the list choose what you want.


if there is nothing there then something isn't working


CPU: AMD 5900x | RAM: GSKILL Trident Z Neo RGB F4-3600C16D-32GTZNC-32-GB | MB:  Asus X570-E | GFX: EVGA FTW3 Ultra RTX 3080Ti| Monitor: LG 27GL850-B 2560x1440


Quic: https://account.quic.nz/refer/473833 R473833EQKIBX 


Move to New Zealand's best fibre broadband service (affiliate link). Free setup code: R587125ERQ6VE. Note that to use Quic Broadband you must be comfortable with configuring your own router.
mentalinc
3239 posts

Uber Geek

Trusted

  #2068966 6-Aug-2018 21:10
Send private message

click "select measurement" and then from the list choose what you want.


if there is nothing there then something isn't working


CPU: AMD 5900x | RAM: GSKILL Trident Z Neo RGB F4-3600C16D-32GTZNC-32-GB | MB:  Asus X570-E | GFX: EVGA FTW3 Ultra RTX 3080Ti| Monitor: LG 27GL850-B 2560x1440


Quic: https://account.quic.nz/refer/473833 R473833EQKIBX 


chevrolux

4962 posts

Uber Geek
Inactive user


  #2068984 6-Aug-2018 21:57
Send private message

Ah right. So when I click that select measurement field, it just shows me the names of the 'tables' in my database ie. StudyTemp.

So I think my issue is how I am putting the info in to the DB. Perhaps I'm not using the correct node.

amanzi
Amanzi
1299 posts

Uber Geek

ID Verified
Trusted
Lifetime subscriber

  #2068989 6-Aug-2018 22:00
Send private message

I don't use node-red, I just have the standard Home-assistant component feeding all data into InfluxDB. That automatically creates a database called home_assistant which is the one that I connect to in the data source screen.


andrewNZ
2487 posts

Uber Geek
Inactive user


  #2068995 6-Aug-2018 22:12
Send private message

Does "StudyTemp" contain only the data you want?
Or do you want to select only part of it for a graph line

chevrolux

4962 posts

Uber Geek
Inactive user


  #2069084 7-Aug-2018 08:03
Send private message

andrewNZ: Does "StudyTemp" contain only the data you want?
Or do you want to select only part of it for a graph line


Yep StudyTemp contains the only data I want... which is why I don't get why I can't just do a select all on that table.


andrewNZ
2487 posts

Uber Geek
Inactive user


  #2069179 7-Aug-2018 10:18
Send private message

Assuming you have set a default database in grafana. Try

From: default. StudyTemp
Select: field(value). Last().

Create new topic


News and reviews »

Air New Zealand Starts AI adoption with OpenAI
Posted 24-Jul-2025 16:00


eero Pro 7 Review
Posted 23-Jul-2025 12:07


BeeStation Plus Review
Posted 21-Jul-2025 14:21


eero Unveils New Wi-Fi 7 Products in New Zealand
Posted 21-Jul-2025 00:01


WiZ Introduces HDMI Sync Box and other Light Devices
Posted 20-Jul-2025 17:32


RedShield Enhances DDoS and Bot Attack Protection
Posted 20-Jul-2025 17:26


Seagate Ships 30TB Drives
Posted 17-Jul-2025 11:24


Oclean AirPump A10 Water Flosser Review
Posted 13-Jul-2025 11:05


Samsung Galaxy Z Fold7: Raising the Bar for Smartphones
Posted 10-Jul-2025 02:01


Samsung Galaxy Z Flip7 Brings New Edge-To-Edge FlexWindow
Posted 10-Jul-2025 02:01


Epson Launches New AM-C550Z WorkForce Enterprise printer
Posted 9-Jul-2025 18:22


Samsung Releases Smart Monitor M9
Posted 9-Jul-2025 17:46


Nearly Half of Older Kiwis Still Write their Passwords on Paper
Posted 9-Jul-2025 08:42


D-Link 4G+ Cat6 Wi-Fi 6 DWR-933M Mobile Hotspot Review
Posted 1-Jul-2025 11:34


Oppo A5 Series Launches With New Levels of Durability
Posted 30-Jun-2025 10:15


Geekzone Live »

Try automatic live updates from Geekzone directly in your browser, without refreshing the page, with Geekzone Live now.


Are you subscribed to our RSS feed? You can download the latest headlines and summaries from our stories directly to your computer or smartphone by using a feed reader.