

Ok, so Bloomfield keeps telling us the increase in case numbers is not exponential. On what basis he is determining that?
Plot below compares the current NZ & NSW and recent QLD delta outbreaks.
Its a semi-log plot so a rising straight line = exponential growth.
Seems rather early in the piece to be confident the growth in our numbers is "not exponential"?
I sincerely hope he is right. It is early days and our 'early' L4 lockdown should help. However, as of now the numbers do not look that great compared to even NSW.
The trend in numbers over the next few days will be very interesting.
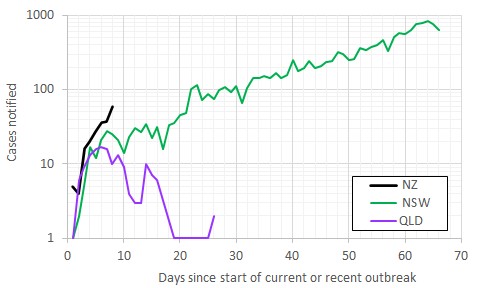
NB: NZ data as per MOH csv file, with dates = 'Report date'. For NSW data (ex similar NSW govt dataset) dates are 'Notification date'
Edit to note that it is the part of the trend above ~10-20 cases that is of interest. NSW trend looks alarmingly linear
Should have noted that the case numbers are cases per day, not cumulative values. Also, no population adjustment has been made.


